背景
一个Presto集群报警,显示Coordinator内存不足。看了下,发现RES内存(86.7G) > XMX(72G) + 堆外内存(10G),然后看了下Presto UI里Resource Utilization的Non-Heap Memory Used,只用了200M。问题奇怪,pmap查看进程的内存映像信息,如下:
1
2
3
4
5
6
7
8
9
10
11
12
| [presto@hostname ~/presto-current]$ pmap -x 107870 | sort -rn -k3 | head -n 10
total kB 106752092 86763996 86684760
00007fd673000000 75644928 61078708 61078708 rw--- [ anon ]
00007fd5c8000000 2654208 2537116 2537116 rw--- [ anon ]
000000000120a000 1244772 1244644 1244644 rw--- [ anon ]
00007fd5803cf000 520388 497972 497972 rw--- [ anon ]
00007fd08c836000 149720 149720 149720 rw--- [ anon ]
00007fd0e2fe2000 147620 147620 147620 rw--- [ anon ]
00007fd0d9b35000 146920 146920 146920 rw--- [ anon ]
00007fe964000000 116672 114164 114164 rwx-- [ anon ]
00007fd0612b1000 111932 111932 111932 rw--- [ anon ]
|
第一列表示虚拟空间地址,第二列表示该项在虚拟空间中占用的大小,第三列表示RSS,第四列表示DIRTY,第五列表示该项名称(anon是佚名的)。
jmap -heap 发现堆内内存占用正常,然后我jmap dump了一份内存,dump后发现只有700M+,应该与堆内存无关了,既然这样查找直接从堆外内存入手了。
查找过程
启动Native Memory Tracker,jvm配置-XX:NativeMemoryTracking=detail参数,重启服务,等现场复现时,通过jcmd pid VM.native_memory detail查看到内存分布如下:
1
2
3
4
5
6
7
8
9
10
11
12
13
14
15
16
17
18
19
20
21
22
23
24
25
26
27
28
29
30
31
32
33
34
35
36
37
38
39
40
41
42
43
44
45
46
47
48
49
50
| [presto@hostname ~/presto-current]$ jcmd 107870 VM.native_memory
107870:
Native Memory Tracking:
Total: reserved=85091386KB, committed=84530010KB
- Java Heap (reserved=75497472KB, committed=75497472KB)
(mmap: reserved=75497472KB, committed=75497472KB)
- Class (reserved=167037KB, committed=167037KB)
(classes #24712)
(malloc=7293KB #110480)
(mmap: reserved=159744KB, committed=159744KB)
- Thread (reserved=461357KB, committed=461357KB)
(thread #447)
(stack: reserved=458488KB, committed=458488KB)
(malloc=1451KB #2268)
(arena=1418KB #892)
- Code (reserved=555591KB, committed=141671KB)
(malloc=23111KB #31456)
(mmap: reserved=532480KB, committed=118560KB)
- GC (reserved=2928579KB, committed=2928579KB)
(malloc=94147KB #57989)
(mmap: reserved=2834432KB, committed=2834432KB)
- Compiler (reserved=719KB, committed=719KB)
(malloc=588KB #919)
(arena=131KB #3)
- Internal (reserved=5296433KB, committed=5296433KB)
(malloc=5296401KB #75822)
(mmap: reserved=32KB, committed=32KB)
- Symbol (reserved=22611KB, committed=22611KB)
(malloc=20110KB #202465)
(arena=2501KB #1)
- Native Memory Tracking (reserved=8111KB, committed=8111KB)
(malloc=463KB #6860)
(tracking overhead=7648KB)
- Arena Chunk (reserved=6019KB, committed=6019KB)
(malloc=6019KB)
- Unknown (reserved=147456KB, committed=0KB)
(mmap: reserved=147456KB, committed=0KB)
|
Internal主要是堆外内存占用,但是不太正常,显示占用5G+,但是我们通过Presto UI发现堆外内存占用只有200M+,难道有堆外内存泄露?查找jcmd里Internal块内存区间,发现Internal只占用了32KB。如下所示:
1
2
3
4
5
6
| [0x00007fe98dff4000 - 0x00007fe98dffc000] reserved and committed 32KB for Internal from
[0x00007fe98c9599d2] PerfMemory::create_memory_region(unsigned long)+0xac2
[0x00007fe98c958624] PerfMemory::initialize()+0x44
[0x00007fe98ca63dcd] Threads::create_vm(JavaVMInitArgs*, bool*)+0x1ad
[0x00007fe98c6c1e64] JNI_CreateJavaVM+0x74
|
那malloc申请的malloc=5296401KB去哪里了呢?只好把jcmd和pmap里面的内存对应起来了。命令:
1
2
| pmap -x 107870 | sort -rn -k3
|
排序一次比照jcmd和pmap内存块,如在jcmd里查找00007fd673000000地址,发现是mmap申请了个xmx堆大小的内存,依次比较,发现很多64M大小的内存块是在jcmd里找不到的。那这些块里存储的是什么的?使用gdb dump一份内存吧,命令:
1
2
| gdb --batch --pid 107870 -ex "dump memory gdb_107870.dump 0x7fd5b4000000 0x7fd5b5000000"
|
导出了16MB数据,之后strings gdb_107870.dump 查看,发现内容如下:
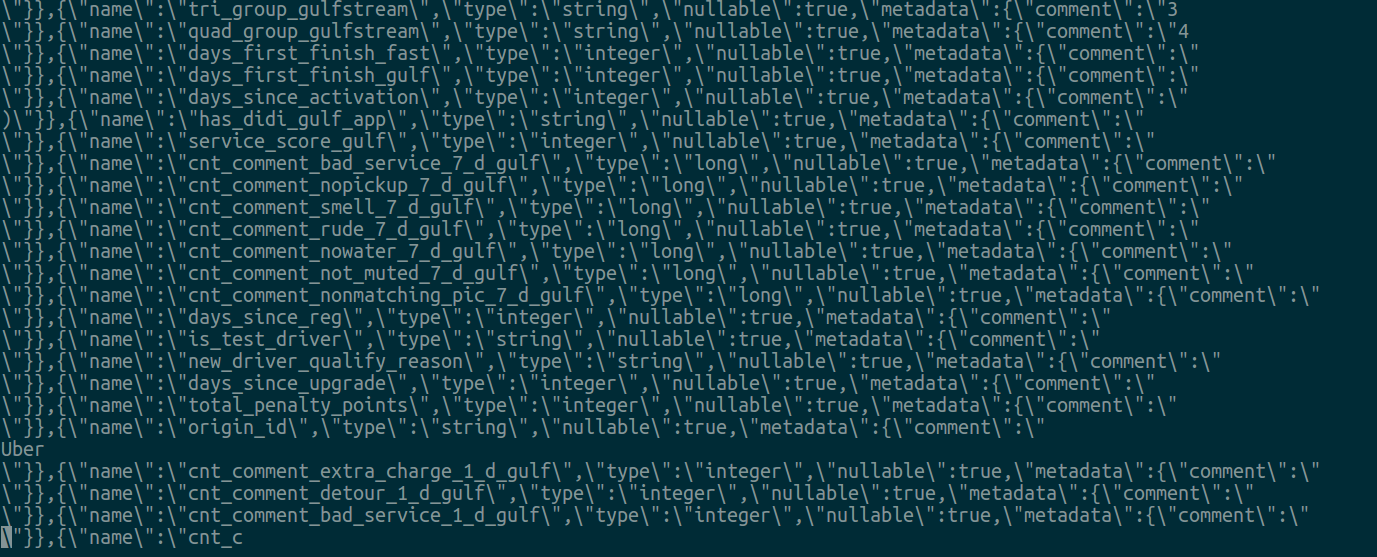
这些应该是堆内内存里,为啥会其他内存分配呢?没有想法,只好去perf了下。
命令:
1
2
| perf record -g -p 107870
|
几十秒后Ctrl+C,执行以下命令查看报告:
1
2
| perf report -i perf.data
|
报告如下,发现除了系统调用外,调用libzip的Deflater非常可疑。
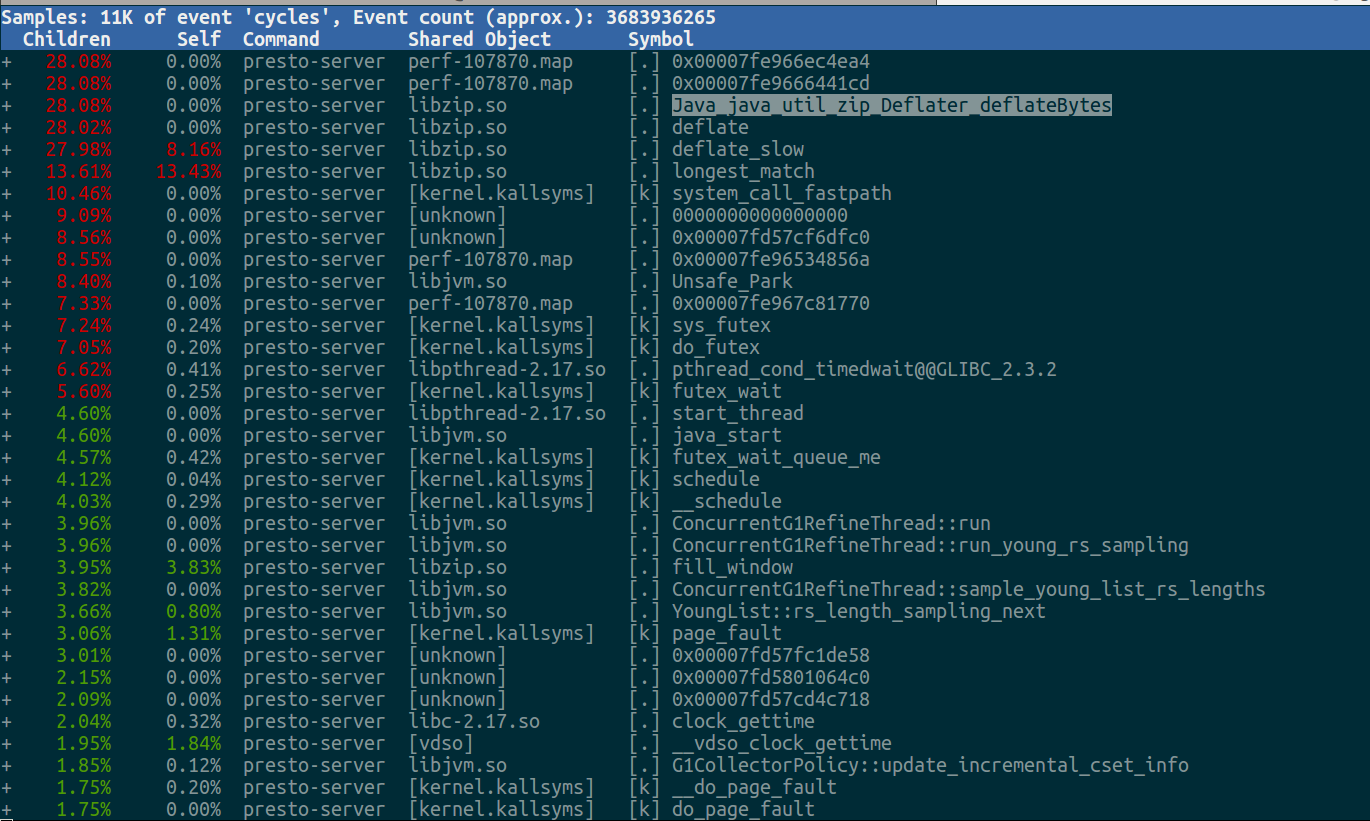
那哪里调用的zip?直接perf打出调用栈即可,内容如下:
1
2
3
4
5
6
7
8
9
10
11
12
13
14
15
16
17
18
19
20
21
22
23
24
25
26
27
28
29
30
31
32
33
34
35
36
37
38
| Started [cpu] profiling
--- Execution profile ---
Total samples : 152
unknown_Java : 2 (1.32%)
Frame buffer usage : 0.5744%
--- 120038581 ns (7.87%), 12 samples
[ 0] longest_match
[ 1] deflate_slow
[ 2] deflate
[ 3] Java_java_util_zip_Deflater_deflateBytes
[ 4] java.util.zip.Deflater.deflateBytes
[ 5] java.util.zip.Deflater.deflate
[ 6] org.eclipse.jetty.server.handler.gzip.GzipHttpOutputInterceptor$GzipBufferCB.process
[ 7] org.eclipse.jetty.util.IteratingCallback.processing
[ 8] org.eclipse.jetty.util.IteratingCallback.iterate
[ 9] org.eclipse.jetty.server.handler.gzip.GzipHttpOutputInterceptor.gzip
[10] org.eclipse.jetty.server.handler.gzip.GzipHttpOutputInterceptor.write
[11] org.eclipse.jetty.server.HttpOutput.write
[12] org.eclipse.jetty.server.HttpOutput.write
[13] org.eclipse.jetty.server.HttpOutput.write
[14] io.airlift.http.server.TimingFilter$TimedServletOutputStream.write
[15] org.glassfish.jersey.servlet.internal.ResponseWriter$NonCloseableOutputStreamWrapper.write
[16] org.glassfish.jersey.message.internal.CommittingOutputStream.write
[17] org.glassfish.jersey.message.internal.WriterInterceptorExecutor$UnCloseableOutputStream.write
[18] com.fasterxml.jackson.core.json.UTF8JsonGenerator._flushBuffer
[19] com.fasterxml.jackson.core.json.UTF8JsonGenerator._writeCustomStringSegment2
[20] com.fasterxml.jackson.core.json.UTF8JsonGenerator._writeStringSegment
[21] com.fasterxml.jackson.core.json.UTF8JsonGenerator._writeStringSegments
[22] com.fasterxml.jackson.core.json.UTF8JsonGenerator.writeString
[23] com.fasterxml.jackson.databind.ser.std.StringSerializer.serialize
[24] com.fasterxml.jackson.databind.ser.BeanPropertyWriter.serializeAsField
[25] com.fasterxml.jackson.databind.ser.std.BeanSerializerBase.serializeFields
[26] com.fasterxml.jackson.databind.ser.BeanSerializer.serialize
[27] com.fasterxml.jackson.databind.ser.std.CollectionSerializer.serializeContentsUsing
[28] com.fasterxml.jackson.databind.ser.std.CollectionSerializer.serializeContents
|
发现是jetty库调用的zip,因为zip的调用方式是这样的:
1
2
3
4
5
6
7
8
9
| try {
Deflater zip = new Deflater(level)
DeflaterOutputStream defStream = new DeflaterOutputStream(out)
}
finally {
defStream.close()
zip.end()
}
|
已知zip是通过jni调用的C语言库,需要close和end,否则会导致堆外内存泄露。找下jetty-server查看下GzipHttpOutputInterceptor的git history,发现jetty调用gzip确实存在着内存泄露:
https://github.com/eclipse/jetty.project/pull/1429
https://github.com/eclipse/jetty.project/issues/300
具体原因大家可以看下上面那个2个PR,jetty在jetty 9.4.20修复了这个问题,我看了下最新的PrestoSQL,airlift里已经将jetty改为新版本了,而我们的Druid.io服务也存在着这个问题,所以先修改jetty依赖,之后看下线上表现吧。
最后,本文只是随手记录了下查找过程,顺便给同事点查找思路,后面的猜测gzip导致了内存泄露,也是因为前面分析是有堆外内存泄露产生,后面发现gzip cpu使用率比较高,且gzip是通过jni调用的,属于堆外内存,顺着这个思路去查找其代码逻辑,然后发现社区修复了这些问题,而我们的jetty依赖还是比较老的版本,所以修改jetty版本,之后上线验证下。